Quantitative Scientist · Human Performance & Health Data

Human performance,
quantified

I'm a PhD movement scientist with a mathematics degree. I've served as the statistical analyst on NIH-funded research teams, and I build the production analytics tools — force plate reports, sprint projection models, gait pipelines — that put those methods in practitioners' hands.

PhD Exercise Science · BS Mathematics Analyst on 4 NIH-funded projects Force plates, IMUs, wearables, motion capture Production tools serving real clients
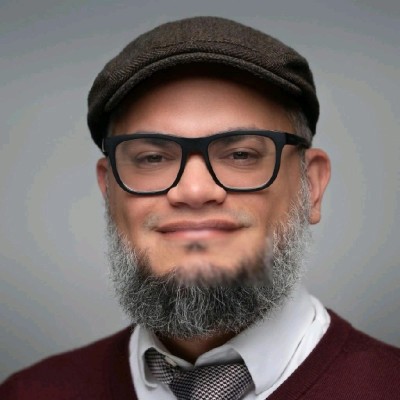
Ferdinand Delgado, PhD

Ferdinand Delgado, PhD

Projects

Real-world analytical systems built for real users — not toy datasets or classroom exercises.

Sport
Analytics · ML

Sprint Performance Projection Dashboard

Problem: Coaches and athletes have no principled way to project next-year sprint times — most rely on intuition or flat conversion tables that ignore individual development trajectories, event profiles, or the structural difference between same-season equivalency and year-over-year growth.

Built a single-file Dash app backed by a SQLite database of Section V meet results spanning five sprint events (55m, 100m, 200m, 300m, 400m). Implemented two model families: same-season equivalency models (OLS + Random Forest, 630 models across events, sexes, and grade levels) to contextualize a current performance relative to peers; and next-year projection models (Mixed Linear Models with random athlete intercepts, ~300 models) to forecast next season's best time from this season's trajectory. Season features include best time, first-meet time, improvement rate, and linear and quadratic trend. Validated via temporal holdout — trained on transitions through 2023, tested on 2024→2025. Integrated the Claude API to generate coach-facing narrative interpretations with SHA-256 response caching and a constrained system prompt that classifies model type, flags sparse-input projections, and enforces domain-appropriate language.

Random Forest Mixed Linear Models OLS Temporal Validation Dash SQLite Python Claude API

Role: Sole developer and analyst

Proprietary

Outcome: Best holdout MAE by event: 55m → 0.14s, 100m → 0.31s, 200m → 0.81s, 300m → 1.22s, 400m → 2.09s. The AI interpretation layer translates model outputs into actionable coaching language — flagging input depth, sprint profile type, and projection confidence — without overreaching into recommendations outside the athlete's event profile.
Sensor
Analytics

Force Plate Assessment Reports

Problem: Coaches and clinicians collecting force plate data had no efficient way to turn raw signals into interpretable, branded reports they could use with athletes and patients.

Built an end-to-end system that pulls raw force-time data via the Hawkin Dynamics API, applies signal processing (Butterworth filtering, COP centering, Savitzky-Golay differentiation), computes derived metrics (sway path length, 95% confidence ellipse, asymmetry indices, EUR, DSI), and generates multi-page PDF reports with trend analysis across sessions. A Flask interface lets non-technical users select athletes, configure tests, and generate reports without touching code.

Signal Processing COP Analysis Feature Extraction Automated Reporting Python REST API

Role: Sole developer and analyst

View on GitHub →
Outcome: Deployed with D1 collegiate athletes, high school programs, and older adult clinical populations. Generates comprehensive assessment reports in under 30 seconds — replacing hours of manual analysis. Currently used as the core service offering of Move, Measure, Analyze LLC.
Clinical
Classification

Gait Deterioration & Fall Risk Classification

Problem: Standard gait assessments capture averages across an entire walk — but fall risk may be better predicted by how gait breaks down over time, especially under fatigue.

Designed a quarters-based segmentation approach for 6-minute walk test data from wearable IMU sensors (APDM Opal). Instead of averaging across the full walk, I extracted gait features per quarter to capture fatigue-related deterioration patterns — speed decline, variability changes, asymmetry shifts. Built the full analytical pipeline: feature engineering, assumption testing, effect size ranking, FDR correction, and logistic regression with ROC/AUC evaluation.

Wearable IMU Data Feature Engineering Logistic Regression ROC / AUC Clinical Research

Role: Sole analyst and pipeline developer

Outcome: Novel feature engineering approach identified gait markers that discriminate fall risk in older adults (n=60). The same analytical logic — extracting temporal patterns from continuous wearable signals — applies directly to health analytics in consumer wearables.
Clinical
ML

Machine Learning for Fall & Dementia Risk

Problem: A clinical gait and mobility assessment produces hundreds of candidate measures. Which of them actually carry signal about fall history — and can they classify risk well enough to matter clinically?

Principal-investigator project at the University of New Hampshire. Screened high-dimensional gait and mobility features with false-discovery-rate adjustment to separate signal from noise, then compared regularized linear models against tree-based ensembles for fall-history classification, evaluated with ROC/AUC.

Feature Screening FDR Correction Regularized Models Tree-Based Ensembles ROC / AUC Python

Role: Principal investigator · sole analyst

Outcome: AUC 0.857 for fall-history classification from clinical gait data. This is the digital-biomarker workflow end to end: high-dimensional movement features in, a calibrated risk signal out.
Sport
Analytics

Hand-Timing Bias in Section V Sprint Results

82,000+ raw records · ~8,400 within-athlete pairs · 100m & 200m · 2008–2025

Problem: High school sprint times are routinely recorded by hand — but hand timing introduces a systematic positive bias relative to fully automatic timing (FAT). How large is that bias in practice, does it vary by performance level, and does it differ between the 100m and 200m?

Scraped and cleaned 17 years of Section V outdoor 100m and 200m results. Applied a within-athlete paired difference design — comparing each athlete's best hand-timed season performance against their best FAT performance in the same season, within a fixed date window that excludes championship meets. Binned results by FAT speed tier to quantify how bias magnitude varies across the performance distribution. Conducted the analysis separately by sex and event, then cross-compared 100m vs. 200m findings.

Large-scale data Web scraping Paired difference analysis Effect sizes Python Sports science

Role: Sole developer and analyst

Outcome: Found the same selection-driven pattern across both events: elite athletes' season bests converge (+0.11–0.15s FAT advantage at the top tier), while hand-timed marks pull ahead by 0.64–0.99s in the slower tiers. The 200m gap is consistently 1.5–2× the 100m gap — ruling out a flat conversion factor across the performance distribution.
Player
Tracking

MLB Baserunning Workload Prototype

Problem: Baserunning is repeated near-maximal sprint work, but it is rarely quantified as workload. Can player-tracking data support exposure and recovery metrics for baserunners?

Prototype built on MLB player-tracking data (2026): extracted peak 1-second speed per baserunning opportunity, then constructed exposure counts and recovery windows across games to characterize sprint load at the player level — the same load-monitoring logic used in track and field, applied to a tracking-data stream.

Player Tracking Data Sprint Workload Feature Engineering Python

Role: Sole developer and analyst

Outcome: A compact prototype, but built on the data type pro sports organizations actually run on — demonstrating the translation of raw tracking output into decision-relevant load and readiness metrics.
Data
Pipeline

Hawkin Dynamics API → Structured Data Pipeline

Problem: Organizations using Hawkin Dynamics force plates had athlete data locked behind an API with no easy way to extract, organize, or analyze it at scale.

Built Python scripts to extract full organizational data from the Hawkin Dynamics API — athletes, teams, groups, and all historical assessment data. Handles pagination, rate limiting, and data type mapping, then outputs clean, analysis-ready Excel workbooks.

REST API Integration ETL Pipeline Data Cleaning Python

Role: Sole developer

Outcome: Automates what previously required manual export and cleanup — giving practitioners immediate access to their full dataset for analysis, reporting, and decision-making.
Research
Operations

VR-Based Balance & Cognition Intervention

Problem: Can immersive VR training improve balance and cognitive function in older adults? Answering this requires a tightly controlled longitudinal study with a population that's hard to recruit and retain.

Designed and executed a multi-session intervention study (2x/week over 8 weeks) with older adult participants. Managed the full research operation: IRB protocols, informed consent workflows, equipment calibration, session-level data collection, and participant scheduling across repeated lab visits. Integrated cognitive, balance, and self-report datasets across timepoints to assess intervention effects and practice-related changes.

Longitudinal Design Human Subjects Research IRB Protocols Multimodal Data Integration Participant Retention

Role: Study lead — design, operations, and analysis

Outcome: Successfully executed a complex multi-visit study with a challenging population. Presented preliminary findings at the Gerontological Society of America Annual Meeting (2024). This is the operational backbone of applied research — the ability to design a study, run it cleanly, and produce trustworthy data.

What I Do

Where domain expertise, quantitative training, and real-world application intersect.

Finding Patterns in Sensor Data

Processing raw signals from force plates, IMUs, and wearables into interpretable features. Butterworth filtering, event detection, COP sway metrics, time-series segmentation — the same workflows used in wearable product R&D and health analytics.

Statistical Modeling & Inference

Multilevel models, structural equation modeling, mediation and moderation, multiple imputation, effect sizes, FDR correction, ROC/AUC evaluation. Trained to ask whether a result is meaningful, not just significant.

Knowing What the Numbers Mean

A decade of working with athletes and clinical populations means I understand what's behind the data — why a gait metric changed, what an asymmetry score means for return-to-play, when a finding is clinically relevant versus statistically noisy.

Building Analytical Systems, Not One-Off Scripts

From API integration to automated PDF generation, I build tools that other people can use — not notebooks that only I can run. Currently operating a consultancy where these systems serve real clients.

Skills

Tools and methods used in production — across research pipelines, client-facing systems, and data products.

Languages
Python R SQL MATLAB Bash HTML / CSS
Statistical Software
Mplus Blimp SPSS G*Power
Data & Analysis
pandas NumPy SciPy scikit-learn statsmodels pingouin tidyverse
Machine Learning
Gradient boosting / XGBoost Random Forest SVM Ridge / LASSO Clustering Logistic Regression Feature screening Temporal holdout validation
Statistics & Methods
Multilevel modeling Structural equation modeling Multiple imputation / FIML Mediation & moderation Factor analysis & PCA Power analysis Effect sizes FDR correction ROC / AUC Experimental design
Sensor & Signal
Force plate analysis IMU / wearable data Butterworth filtering COP metrics Time-series segmentation Gait analysis
Instrumentation
Motion capture (Vicon, Qualisys, OpenCap markerless) Force plates (AMTI, Bertec, Hawkin Dynamics) APDM Opal IMUs EMG Perturbation treadmill Metabolic cart
Visualization
matplotlib seaborn plotly ggplot2 Dash
Tools & Infra
Git / GitHub Jupyter Flask Playwright REST APIs Jinja2 SQLite MariaDB

Experience & Appointments

2026 – Present

Assistant Professor of Kinesiology

Wilberforce University · Wilberforce, OH

Tenure-track faculty building a research program on human movement and performance data — force-plate and sensor-based assessment with quantitative and machine-learning methods — alongside teaching in kinesiology.

2025 – Present

Founder & Director of Performance Analytics

Move, Measure, Analyze LLC · movemeasure.com

Mobile sports-science practice built on production analytics: automated force-plate assessment reporting, mixed-effects sprint projection modeling, and balance assessment — systems deployed with collegiate and high school athletes and older adults.

2023 – 2026

Research Scientist, Kinesiology

University of New Hampshire · Durham, NH

Statistical analyst on aging and mobility research: built IMU gait-analysis pipelines, machine-learning fall-risk classification (AUC 0.857), and multilevel models of gait deterioration by fall history; instructor of Applied Biomechanics.

2018 – 2022

Research Associate

Arizona State University · Phoenix, AZ

Analyst across NIH-funded aging, cognition, and mobility studies — APOE and falls, dual-task gait, VR balance interventions — with responsibility for study statistics from design through publication.

Research

Credibility that no portfolio project can substitute for: funded research teams, and a track record as the analyst on them.

Funded Research Contributions

Statistical analyst and research team member on federally and foundation-funded projects in aging, mobility, cognition, and neurodegenerative disease:

  • NIH R01 AG075892 — aging & mobility research team
  • NIH R01 AG055469 — aging & cognition research team
  • NIH R01 AG043392 — aging & falls research team
  • NIH R21 AG050084 — aging research team
  • U.S. Department of Veterans Affairs — funded research team
  • The Michael J. Fox Foundation — Parkinson's research team

Statistical Analyst of Record

On interdisciplinary research teams, I'm the person who does the analysis. I've served as statistical analyst of record on peer-reviewed publications and the majority of published conference abstracts below — spanning mediation analysis, structural equation modeling, multilevel modeling, and classification.

Ongoing analytical programs include carbon-fiber plated footwear gait analysis (three published abstracts; manuscript under review) and the APOE genotype, executive function, and falls program.

Publications

Peer-reviewed research and published conference abstracts. The Δ symbol indicates I performed the statistical analysis.

Peer-Reviewed Articles

Ghoreishi, N., Ansah, S., Lu, J., Lu, W., Moon, S., Delgado, F., & Chen, D. (2026). Evaluation of the importance of Stopping Elderly Accidents, Deaths, and Injuries (STEADI)–based factors in wearable fall risk assessment: Secondary data analysis. JMIR mHealth and uHealth. doi:10.2196/93877

Delgado, F.Δ, Yu, F., Peterson, D.S., Ofori, E., MacKinnon, D.P., Belden, C., Adler, C.H., Beach, T.G., & Der Ananian, C. (2025). Apolipoprotein E, executive function, and falls across cognitive status: A cross-sectional study. Dementia and Geriatric Cognitive Disorders. doi:10.1159/000548084

Ofori, E., Delgado, F.Δ, James, D.L., Wilken, J., Hancock, L.M., Doniger, G.M., & Gudesblatt, M. (2024). Impact of distinct cognitive domains on gait variability in individuals with mild cognitive impairment and dementia. Experimental Brain Research. doi:10.1007/s00221-024-06832-9

Vento, K.A., Delgado, F.Δ, & Lynch, H. (2022). Lipid profiles of college female student-athletes participating at different competition levels of organized sport. Frontiers in Sports and Active Living. doi:10.3389/fspor.2022.841096

Vento, K.A., Delgado, F.Δ, Skinner, J., & Wardenaar, F. (2021). Funding and college-provided nutritional resources on diet quality among female athletes. Journal of American College Health. doi:10.1080/07448481.2021.1947301

Delgado, F. & Der Ananian, C. (2021). The use of virtual reality via head-mounted display on balance and gait in older adults: A scoping review. Games for Health Journal, 9(6). doi:10.1089/g4h.2019.0159

Published Refereed Abstracts

Delgado, F.Δ & Moon, S. (2025). Wearable-derived gait features and fall history in older adults. Innovation in Aging, 9(S2). Gerontological Society of America Annual Meeting, Boston, MA.

Delgado, F.Δ & Greenberg, J.J. (2024). Cognitive and practice effects of immersive virtual reality use in older adults: Preliminary results. Innovation in Aging, 8(S1). Gerontological Society of America Annual Meeting. doi:10.1093/geroni/igae098.3939

Delgado, F.Δ, Yu, F., MacKinnon, D.P., Peterson, D.S., Ofori, E., Adler, C., Beach, T.G., & Der Ananian, C. (2023). Severe Alzheimer's dementia alters the relationship between executive function and falls. Innovation in Aging, 7(S1). Gerontological Society of America Annual Meeting. doi:10.1093/geroni/igad104.3588

Delgado, F.Δ, Kaczmarek, O., Trebing, S., Zarif, M., Gudesblatt, M., & Ofori, E. (2021). Exploratory cross-sectional mediation analysis of the dual-task effect of cognition on gait in individuals with memory loss. Alzheimer's & Dementia, 17(S7). Alzheimer's Association International Conference. doi:10.1002/alz.054495

Delgado, F.Δ, Der Ananian, C., & Peterson, D. (2020). Balance and reactive steps in older adults with and without self-reported musculoskeletal conditions. Innovation in Aging, 4(S1). Gerontological Society of America Annual Meeting. doi:10.1093/geroni/igaa057.1683

Delgado, F.Δ, Der Ananian, C., & Merkel, A. (2019). Changes in physical function and body composition among group lifestyle balance program participants with arthritis. Medicine & Science in Sports & Exercise, 51(6S). American College of Sports Medicine Annual Meeting. doi:10.1249/01.mss.0000561144.22005.d2

+ 4 additional published abstracts · 3 manuscripts currently under review

Full publication list (CV PDF) → | Google Scholar →
Education

PhD 2023
Arizona State University
Exercise & Nutritional Sciences
Emphasis in Biomechanics & Motor Control
Graduate Certificate 2025
University of New Hampshire
Data Science
MS 2017
Texas A&M University–Corpus Christi
Kinesiology
Emphasis in Sport Science
BS 2006
State University of New York–College at Brockport
Mathematics

Let's work together

I'm open to applied sports science and performance analytics roles — sports scientist, performance scientist, performance analyst — as well as research scientist, data scientist, and quantitative roles in wearables, digital health, and health analytics. Also available for consulting through Move, Measure, Analyze.